
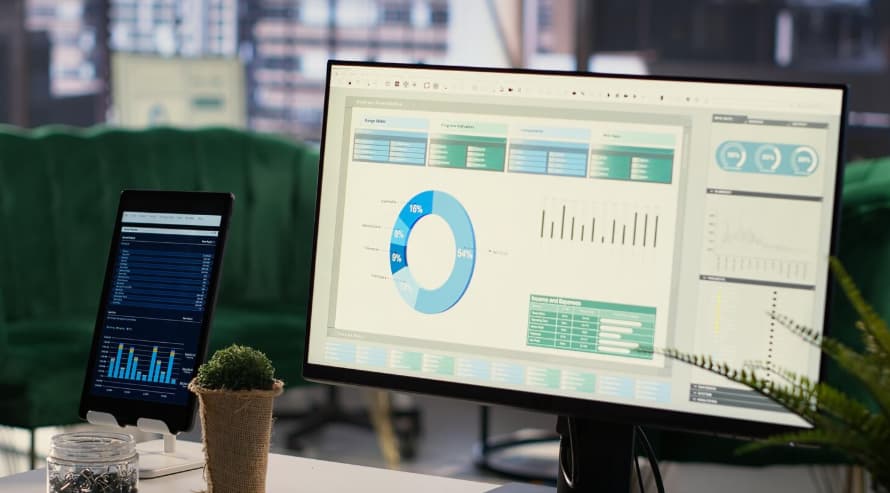
Creating a Financial Dashboard You’ll Actually Use
The workday is a dozen things at once. You’re managing sales, dealing with customer issues, and keeping the lights on. Checking the books? It’s postponed until it becomes a critical issue. Spreadsheets don’t help. They’re confusing, a pain to update, and basically useless for a quick decision. What you actually need is a simple screen—one look, and you know exactly where the business stands right now.
A good dashboard turns all those scattered numbers into information you can actually use. Financial management stops being something you dread and starts feeling like a real tool for running the business better.
You get to make decisions with more confidence, notice problems coming before they hit hard, and spend your time on the things that actually matter most.
We’re going to guide you through creating a useful financial dashboard. The result will be a straightforward tool that becomes part of your daily routine.
What to Include in Your Dashboard
The biggest mistake is trying to include everything on a dashboard. Too much information confuses. Your goal should be clarity, not complexity. Focus on 5-7 key performance indicators that directly reflect your business’s health and goals.
Here are the metrics that matter most for most small businesses:
- Cash Flow: Your net cash position (cash in minus cash out). This is the ultimate measure of liquidity. Track it weekly to ensure you can cover expenses.
- Profit & Loss (Income Statement Summary): Display monthly revenue, cost of goods sold (COGS), and net profit. A simple bar chart can show trends over time.
- Accounts Receivable Aging: How much money is owed to you, and for how long? This highlights collection issues before they become critical.
- Accounts Payable Aging: What you owe to suppliers. Managing this helps maintain good vendor relationships and cash flow.
- Revenue by Product/Service or Customer: Identify your top performers. This tells you where your profit is really coming from.
- Burn Rate & Runway: For growth-focused businesses, how fast are you spending cash, and how many months can you operate at the current rate?
- Key Ratio: Choose one like Gross Profit Margin or Quick Ratio relevant to your industry. This adds a layer of analytical depth at a glance.
Avoid adding extra metrics. Every new number you include makes the dashboard more cluttered and less effective. A useful test is to ask: does this information require an immediate decision, or does it answer a critical question about my business? If not, it should not be on your main dashboard screen.
A dashboard should provide understanding, not just display numbers. Restricting it to 5-7 primary metrics gives you a sharp, current story of how your business is performing. This clarity enables you to quickly comprehend your position and choose a course of action, free from less relevant details.
This disciplined approach is what makes the tool genuinely useful for daily leadership.
Building Your First Financial Dashboard
Forget needing some expert background. You really don’t. The programs now are easy point-and-click. Spend a couple of afternoons linking your bank, sales, and expenses, and you end up with a dashboard that tells you the important details without confusion.
The idea isn’t to get everything right immediately. Start with clear basics that help you right away, then improve whatever part starts annoying you.
1. Connect Your Data Source
The first step is connecting to your real accounting data. Use QuickBooks Online, Xero, or whatever program has your actual records. Link the dashboard straight to it. That way, all the numbers stay correct and up to date. No good connection means the dashboard shows wrong or old info. Do this part right first.
Manually exporting and importing data is not only time-consuming but also introduces a high risk of error. By connecting directly, you build your dashboard on a single source of truth, guaranteeing the integrity of the information you’ll be viewing.
Once you have your data source connected, you need a tool to visualize it. This is the role of dashboard or business intelligence (BI) platforms. Options like Microsoft Power BI, Google Looker Studio, or Tableau are built for this task. They typically offer intuitive, drag-and-drop interfaces that don’t require programming skills.
These platforms provide the functionality to create your dashboard, offering various chart styles, formatting choices, and layout options. When choosing one, evaluate the cost, its user-friendliness, and how well it connects to your main data source. Many have strong free tiers or trial periods that are perfectly suitable for a small business dashboard.
2. Create Visual Charts and Graphs
This is where data becomes insight. Drag and drop your chosen metrics to create:
- A line chart for cash flow over the last 90 days.
- A bar chart comparing monthly revenue and profit.
- A gauge or a big number for your current bank balance.
- A table or pie chart for the top customers.
- A treemap for product/service performance.
For QuickBooks users who want to avoid manual setup and exports, there are dedicated integration options that handle the technical connection. Resources such as https://quickbooks-topowerbi.com/ outline how accounting data can be automatically connected to visual dashboards, simplifying setup and keeping reports consistently up to date.
3. Make It Update Automatically
A dashboard that requires you to manually input numbers every week is destined to fail. You’ll inevitably stop using it. The real solution is to automate the process. Set up your BI tool to schedule automatic data refreshes. It will pull the latest figures from your accounting software on its own, daily or weekly.
Once this is configured, your dashboard becomes a self-updating, live report. This automation is what transforms it from a one-time project into a practical, daily tool that stays consistently useful.
Reading and Acting on Your Dashboard

If it doesn’t change what you do, a dashboard is useless. You must interpret it and act. The key is consistency. Schedule a strict five-minute review every week. That discipline makes it a real tool.
This brief but regular check-in serves as a reliable status update for your business. It moves you from making decisions with limited information to operating with clear insight. Consider it your essential weekly operational briefing, a focused meeting where you assess your financial position and plan your immediate priorities.
What to Look For Each Week
Here is a practical checklist for your weekly financial review.
- Cash Position: Check the direction of your cash flow trend. Then, verify you have enough cash on hand to meet next week’s expected expenses.
- Profit Status: Review your month-to-date profit and compare it to the same point in the prior month to spot trends.
- Late Payments: Identify any invoices in your Accounts Receivable that are 31+ days old. These require a collection follow-up.
- Sales Analysis: See which products or customers are driving revenue. Note any significant changes to understand where to prioritize your strategy.
Red Flags That Need Immediate Attention
Your dashboard will flag real trouble, and you need to know when it’s time to act, not just look. Here’s what that means in plain terms. If your cash flow remains negative for two weeks or longer, it is a serious problem. You are spending more money than you are receiving. You must halt all non-essential spending at once and begin pursuing every overdue invoice for payment. This requires immediate action.
Watch the column for invoices over 60 days old. If that number is creeping up, your collection system is broken. It’s time to get strict—tighten your payment terms and automate your follow-ups.
A sudden nosedive in sales for your top product? That’s a five-alarm fire. Don’t wait to figure it out. A competitor just moved in, your quality slipped, or your sales channel failed. Investigate today.
If your revenue is steady but your net profit is going down, your costs have gone up. You must examine every individual expense to find the source. A specific cost has increased and is reducing your profit margin.
The dashboard identifies the problem area. You are still responsible for solving it. However, the dashboard ensures you know the exact location of the issue.
Keeping Your Dashboard Current
A dashboard isn’t permanent. Your business changes, and if your dashboard doesn’t change with it, it’ll become useless. You can’t just set it up and forget it. The solution is to schedule a short review every quarter—30 minutes is enough.
In that review, ask yourself a few practical questions:
- Are my metrics still right for my goals? If your focus has shifted from growth to cutting costs, your dashboard should show that. Update it to track what actually matters right now.
- Is there something new I should be tracking? If you keep wondering about a specific number during the week—like cost per new customer or project turnaround time—that’s a sign you need to add it to your dashboard.
- What can I remove? Find the chart or number you never look at. Get rid of it. Less clutter means you see the important information faster.
- Has my business changed in a big way? Did you add a new service, start using a loan, or change your customer base? Major changes usually mean you need to add a new key metric.
This quick check-in keeps your dashboard working for you. It stops the tool from becoming outdated and makes sure you’re still seeing the clearest picture of your business. That 30 minutes every few months guarantees the dashboard keeps saving you time instead of wasting it.
Conclusion
A financial dashboard is a management tool. It pulls your scattered numbers from different places and organizes them into one clear view you can actually use. The steps are simple: choose a few key numbers that matter to your business, show them as charts or graphs, and set up the system to refresh the data automatically.
The benefit is how it changes how you work. You stop dealing with constant financial surprises and emergencies. Instead, you have the information you need to see problems coming. When you can check your cash, profit, and trends in a few seconds, you can make quicker, more confident decisions. This helps you run your business strategically instead of constantly reacting.
The key is to start with a simple setup and use it consistently. Build the habit of a weekly five-minute review. This discipline transforms the dashboard from a static report into a core management tool.
Ultimately, this isn’t about complex charts. It’s about getting your time back and reducing uncertainty. It gives you direct control over your financial trajectory, allowing you to steer your business deliberately rather than just hoping for the best.